Light > Measure & Model Light Availability to the stream surface and to the streambed
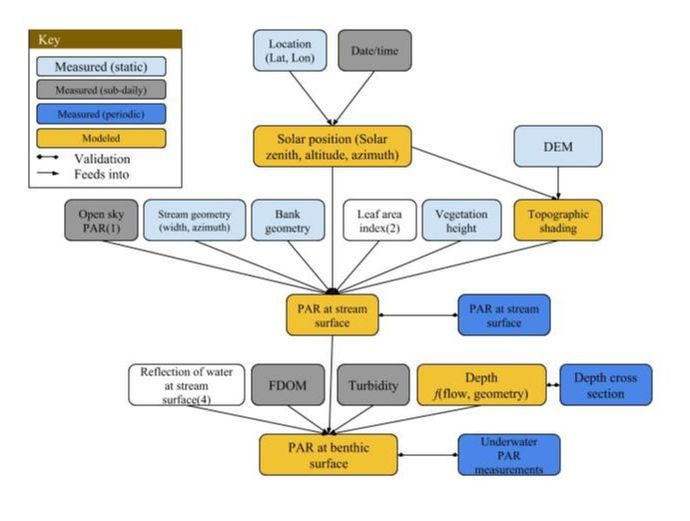
Figure 1. Flow chart conceptualizing the way in which continuous data, targeted field surveys, and modeled data interact to estimate and validate benthic PAR. Open sky PAR (μmol m-2 s-1) derived from conversion of HOBO measurements (lumens m-2)
LAI can be derived from interpolating MODIS LAI into daily timesteps. We will validate this product through periodic field sampling, and, where necessary, replace it with upward facing digital cameras where MODIS LAI estimates are unavailable or untenable.
This will be derived from dual sensor measurements above and just below the water surface, with measurements taken during field visits, noting time of day.
|
MEASUREMENT
SOP 1: Measuring Irradiance (sub-daily) This contains instructions for the measurement of sub-daily (15 min time steps) irradiance. Light will be measured using a HOBO pendant data logger which records lux (lumens m-2) and this will need to be converted to PAR (μmol m-2 s-1) as outlined below.
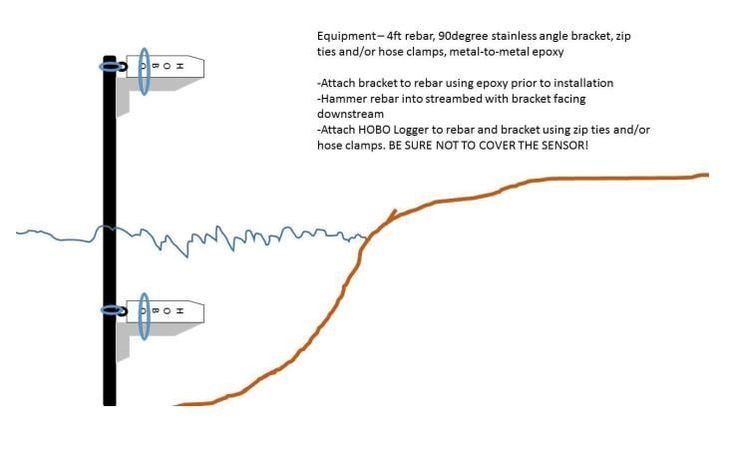
-Mounting |
- Conversion from HOBO pendant data logger (lumens m-2) to PAR (μmol m-2 s-1)
The calibration between the two sensors may potentially vary with water characteristics, and thus vary across sites. To address this, we (either Duke/Florida) also plan to repeat this calibration across water with varying turbidity in order to determine if the relationships differ as a result of water characteristics. This will determine whether a single calibration between the two sensors can be applied to all sites or if it will be necessary for sites to perform their own calibrations. At least initially, it would also be prudent to perform this calibration periodically (maybe 6 months/ 1 year) to see if there is any sensor drift.
1. Open sky irradiance
Open sky irradiance will be measured by placing a HOBO pendant data logger placed in the open as close as is practical to the study sites (<=~5 miles) . Because variability in received irradiance at the Earth’s surface is related to the variation in topography, the acceptable distance between the sensor capturing open sky irradiance and the study site may vary with local topographic conditions.
2. Top-of stream irradiance
One HOBO pendant data logger should be placed close to the other deployed sensors and near the stream surface but above the mean high water level. Depending on the particular setup this may mean that the sensor could be placed on the top of your sensor array or as an independent installation (see Fig. 2). PI’s should have several (~3) additional HOBO sensors and these can be distributed along the stream path at the discretion of the PI in order to characterize spatial variability in the light environment near the stream surface.
3. In stream irradiance
A HOBO pendant data logger should be placed in the water below mean low water levels (probably near the depth where your O2 sensors are deployed). One possible way to do this is illustrated in Figure 2. While the sensor will be setup to record light at 15 minute intervals, the likelihood of biofouling dictates that this data will not be continuous and is provisional. However, if the sensor is cleaned periodically (perhaps once a week when data are downloaded) the combined top-of-stream and in-stream irradiance at subdaily time steps for even a few days a week would vastly increase the amount of information collected regarding the transmittance of light through the water column under varying water conditions. This can supplement the periodic field sampling described in SOP2.
SOP 2: Deriving Benthic Irradiance From Rating Curves
This contains information on the steps required to derive benthic irradiance from several other measured data products.
- Equipment
-If using a boat, a pole marked with depths that has an elbow to prevent shading from the boat
- Depth as a function of stage
- Water surface reflectance & water column light attenuation
a.) Field measurements of water surface reflectance: One HOBO light meter should be placed just above and below the water surface and concurrently taking measurements. Reflectance = (1- below/above) * 100.
b.) Field measurements of transmittance with depth: Take an instantaneous light profile in a deep part of the channel. One HOBO light meter is locked into place above the water. Concurrently, a second HOBO light meter is lowered into the water. The lowered light meter is mounted on a pole which is marked with depths (which has an elbow to prevent the boat from shading). Point the light meter south and log readings every 10cm or 0.5m to hit several depths. Transmittance = lowered/above * 100.
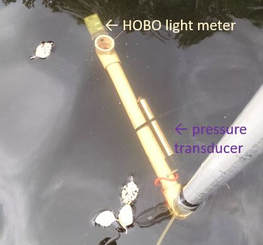
If you have an extra pressure transducer, you can launch the two HOBO light meters and the pressure transducer to log every 10 seconds, synced to the same computer clock. Then you don't have to worry about recording depths or times, just strap the pressure transducer to the pole with the lowered light meter, and raise and lower them for 5 - 10 minutes in the water, and you will have plenty of data points. This set-up is especially convenient if you're doing several light profiles in the same day.
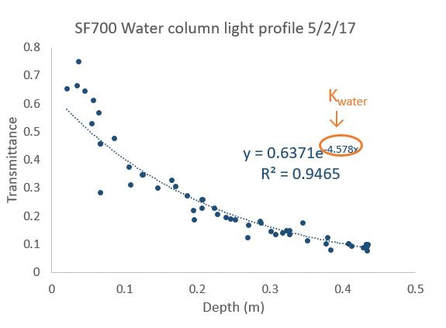
c.) Post-processing of field collected data: Graph transmittance vs depth. According to Lambert’s Law, light decays exponentially with depth, so fit an exponential curve to the data. Kwater is the exponential decay constant. Here’s an example from a blackwater creek:
As you can see, there is more noise in the shallower part of the water column (due to reflective scatter), and this will be more noticeable for clearwater streams/rivers. The deeper the light profile can go and the more attenuation in the water column, the better the exponential fit will be. To give you an idea of the range of Kwater, spring-fed rivers in FL have a Kwater of about 0.3 and blackwaters have a Kwater as high as 8. The y-intercept is the reflectance (actually, reflectance is 1 - intercept or 36%). Alternatively, you can set the y-intercept for the fitted exponential curve to what was calculated in part a.
d.) Theoretical light attenuation: Filtered and unfiltered grab samples should be collected for analysis of full-spectrum 1-D transmittance of visible light (400-800 nm) on a spectrophotometer (n = 4 to 12 per year). Collect these grab samples on days the water column light profile is done. This yields an extinction coefficient, k, that can be modeled as f(fDOM, turbidity), and scaled to the reach based on depth distribution. Matt Cohen (UF) has access to a spectrophotometer and could potentially provide analysis on samples from all of the sites.
These multiple measurements will be combined as follows.
- Model continuous HOBO measurements (1 depth) of attenuation as a function of depth, solar angle, and fDOM/turbidity
- Model discrete field HOBO measurements (multiple depths) as a function of depth and fDOM/turbidity.
- Evaluate departure from 1-D light attenuation assumptions by comparing field measurements with grab sample transmittance; assess as a function of depth and fDOM/turbidity.
- Integrate into a single time series of benthic light availability using these multiple models, and time variation in continuous predictors (depth, solar angle, and fDOM/turbidity).
|
SOP 3: Riparian canopy height
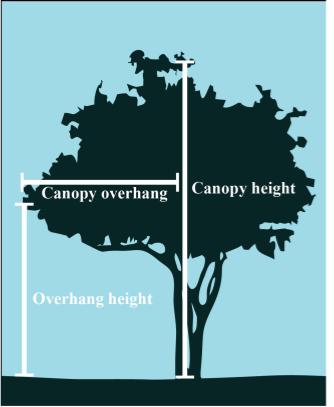
The measurement of riparian overstory canopy height is needed for developing a model to predict light conditions at the top of the stream that accounts for the geometry of the stream and surrounding landscape.
Link; $399) or separate clinometer & laser range finder
|
2. MAPPING (in progress)
Spatial variability in transmittance: Measurements should be made at the same locations as channel cross-sections, this will provide data on a transect roughly perpendicular to the bank which coincides with all of the other channel measurements. By repeating these measurements we can have data on the spatial variability of cross-sectional profile of light at individual locations, temporal variations in cross-sectional profiles of light at individual locations, and spatial variations in light across multiple locations.
Synoptic measurements (n = 4 per year) of transmittance from throughout the study reach (spanning lateral and longitudinal variation in stream canopy cover; this will include streambank effects for deeply incised channels). This requires 20-30 measurement locations. This can be done using 1) hemispherical photos or 2) LAI/transmittance meter (e.g. LICOR 2200).
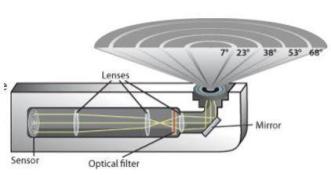
It’s not necessary to use a LICOR 2200C, but it has some advantages. It has a fish-eye lens that captures light at five angles. We actually aren’t so concerned with LAI, but the percent transmittance at each of the five angles. In lieu of a LICOR 2200C, you can use a densiometer, solar pathfinder, or fisheye camera (the disadvantage is that you won’t get nearly as many readings given the time it takes) or two HOBO light meter (one in the open field or parking lot and one you take with you on the river, just write down the time). Post-processing: For each LAI reading, average the five percent transmittances together.
3. MODELING (in progress)
This section describes the estimates of the variability of the light environment from a predictive model based on current understanding of the major processes involved. This consists of multiple measured and modeled components, as well as data required for model validation (Fig.1 ).
Modeled top-of strem irradiance (sub-daily): Modeled top-of-stream PAR (μmol m-2 s-1) will be produced at 15 min time steps with the following major components:
1. Effects of canopy attenuation as light passes through the canopy: The fraction of incident beam radiation penetrating a canopy can be described via leaf area index (LAI) and the leaf distribution. There are a number of canopy radiative transfer models based on these premises and a model will be chosen based on the required model complexity and availability of measurements needed to drive the model.
a.) LAI (daily): Daily estimates may be derived from interpolating MODIS data. I am most familiar with the MOD15A2 product which uses the TERRA satellite to derive 8 day composite images at 500m spatial resolution. However, it appears that there is a newer product which combines TERRA and AQUA to generate 4 day composites at 250m spatial resolution. The plan at present is to utilize Google earth engine to extract this data so that users do not have to locally download this information but this is awaiting implementation at present.
2. Effects of geometry on light: Stream azimuth,stream width, bank height, vegetation height, and solar geometry interact to produce shading at the stream surface. These factors will be considered so that light is estimated based on contributions from light which must pass through a canopy and light which reaches the stream surface unimpeded.
REFERENCES
- Davies-Colley, R. J., & Nagels, J. W. (2008). Predicting light penetration into river waters. Journal of Geophysical Research: Biogeosciences, 113(G3). doi:10.1029/2008JG000722 (link to paper)
- Julian, J.P., M.W. Doyle, and E.H. Stanley. 2008. Empirical modeling of light availability in rivers. Journal of Geophysical Research - Biogeosciences 113: G030222. doi:10.1029/2007JG000601(link to paper)
- Long, M. H., Rheuban, J. E., Berg, P., & Zieman, J. C. (2012). A comparison and correction of light intensity loggers to photosynthetically active radiation sensors. Limnology and Oceanography: Methods, 10(6), 416-424. doi:10.4319/lom.2012.10.416 (link to paper)
