Preparing Rating Curves for Discharge Estimation
Discharge cannot be measured continuously with the sensors used on the StreamPULSE project. At monitoring sites not correlated with a USGS stream gauging station stage-discharge relationships must be developed to predict discharge from recorded water stage. Rating curves are utilized to combine continuously monitored water level data with with measured velocity data to produce a regression for estimating discharge.
Getting started with velocity measurements
Velocity should be recorded at various flow stages from low summer baseflow to high storm flow in order to achieve the best regression to predict discharge. Velocity can be measured in either of the two ways listed below:
Flow meter method
EPA
http://itepsrv1.itep.nau.edu/itep_course_downloads/Water_QAPP_TAMS_Center_ITEP/QA%20Project%20Plan/Mod5%20SOPs/Miscellaneous%20Field%20Procedures/Region%206%20Flow%20Measurement%20SOP%20updated%2001-31-03.pdf
USGS
https://pubs.usgs.gov/wsp/wsp2175/pdf/WSP2175_vol1a.pdf
Process:
Salt Dilution Gauging method:
USGS
https://pubs.usgs.gov/wsp/wsp2175/pdf/chapter7_vol1.pdf
Process:
Data analysis for dilution gauging is described in the protocols below
https://www.uvm.edu/bwrl/lab_docs/protocols/2005_Hudson_and_Fraser_Simple_slug_salt_dilution_gauging_method_Streamline.pdf
http://www.wseas.us/e-library/conferences/2015/Malaysia/ENVIR/ENVIR-05.pdf
Rating Curve Development
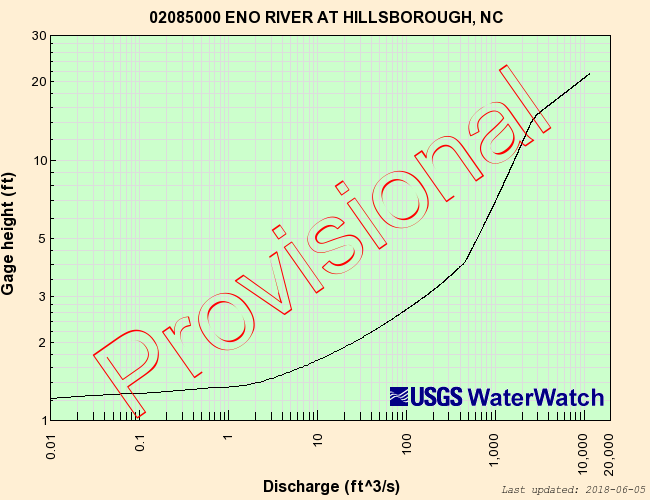
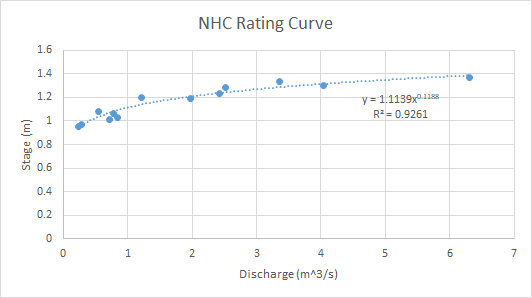
Once velocity has been measured over a range of discharges a relationship between the water level logger and velocity will start to develop. Here are examples of rating curves for StreamPULSE sites around Durham, NC. Notice the difference between the USGS rating curve and StreamPULSE’s measured rating curve. The USGS has advanced ways of calculating discharge at high flows. We are limited in this project by the depth of the water because it isn’t feasible to measure discharge by hand at high flows.
Discharge cannot be measured continuously with the sensors used on the StreamPULSE project. At monitoring sites not correlated with a USGS stream gauging station stage-discharge relationships must be developed to predict discharge from recorded water stage. Rating curves are utilized to combine continuously monitored water level data with with measured velocity data to produce a regression for estimating discharge.
Getting started with velocity measurements
Velocity should be recorded at various flow stages from low summer baseflow to high storm flow in order to achieve the best regression to predict discharge. Velocity can be measured in either of the two ways listed below:
Flow meter method
EPA
http://itepsrv1.itep.nau.edu/itep_course_downloads/Water_QAPP_TAMS_Center_ITEP/QA%20Project%20Plan/Mod5%20SOPs/Miscellaneous%20Field%20Procedures/Region%206%20Flow%20Measurement%20SOP%20updated%2001-31-03.pdf
USGS
https://pubs.usgs.gov/wsp/wsp2175/pdf/WSP2175_vol1a.pdf
Process:
- Locate reach of stream representative of stream reach
- String across a tape measure and secure to both stream banks
- Delineate what increment velocity will be measured. At least 20 increments are needed for good discharge estimation
- Measure velocity and stream depth at set increments and when the slope of the cross-section changes drastically
- Calculate discharge for each increment. Q=V*A
- Sum each increment to achieve whole stream discharge
Salt Dilution Gauging method:
USGS
https://pubs.usgs.gov/wsp/wsp2175/pdf/chapter7_vol1.pdf
Process:
- Locate reach of stream representative of stream reach
- Place conductivity logger into stream and set to record every two seconds
- Walk the appropriate mixing length above the conductivity logger. Mixing length should be 20 times the stream width at the conductivity logger
- Pour salt into bucket and mix together while the bucket is in the stream to prevent temperature increase. Amount of salt will vary depending on stream discharge. The goal is to double the baseflow conductivity with the salt addition. 100g NaCl for headwater streams, 500g NaCl for up to third order streams, +1000g NaCl for up to fifth order streams.
- Allow salt to completely dissolve while mixing in bucket.
- Note the exact time down to the second and dump the salt solution into the stream
- Wait for all of the salt to pass the conductivity logger. Try to be within 5% of the initial conductivity reading
- Collect data from conductivity sensor
Data analysis for dilution gauging is described in the protocols below
https://www.uvm.edu/bwrl/lab_docs/protocols/2005_Hudson_and_Fraser_Simple_slug_salt_dilution_gauging_method_Streamline.pdf
http://www.wseas.us/e-library/conferences/2015/Malaysia/ENVIR/ENVIR-05.pdf
Rating Curve Development
Once velocity has been measured over a range of discharges a relationship between the water level logger and velocity will start to develop. Here are examples of rating curves for StreamPULSE sites around Durham, NC. Notice the difference between the USGS rating curve and StreamPULSE’s measured rating curve. The USGS has advanced ways of calculating discharge at high flows. We are limited in this project by the depth of the water because it isn’t feasible to measure discharge by hand at high flows.

